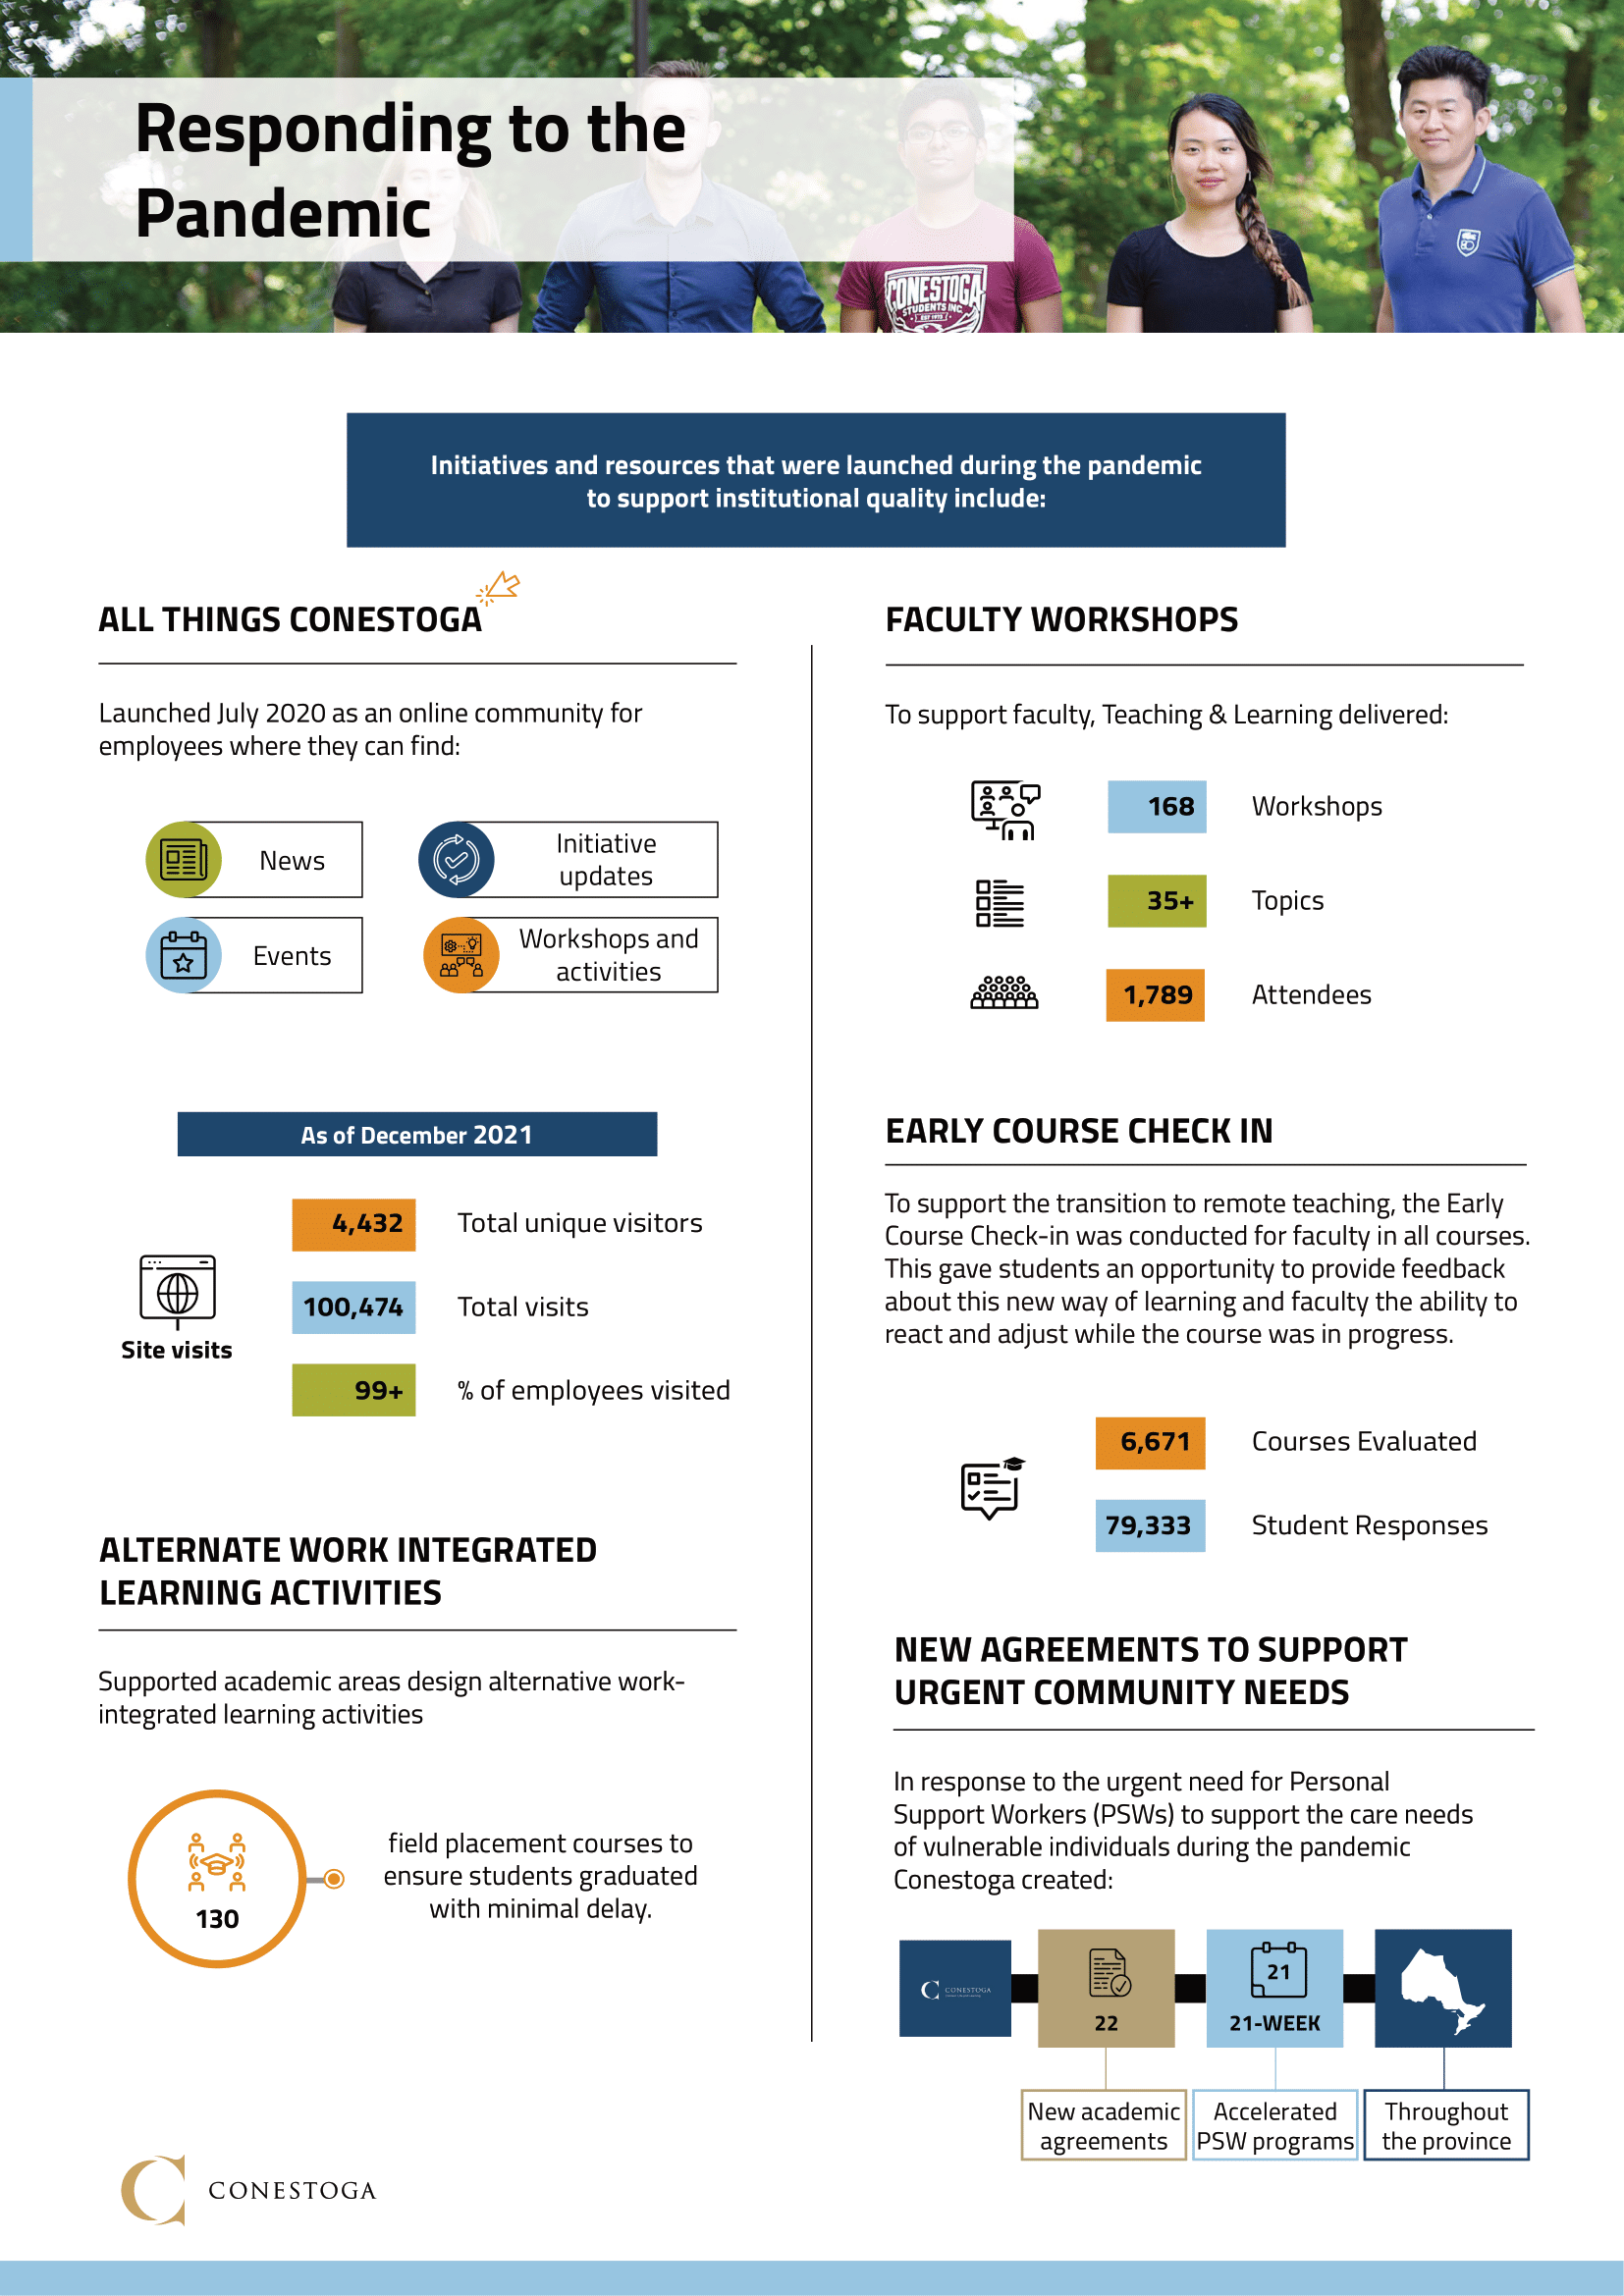
Academic Administration Quality Infographic
Client, Conestoga College
Tools Used: Adobe InDesign, Adobe Illustrator
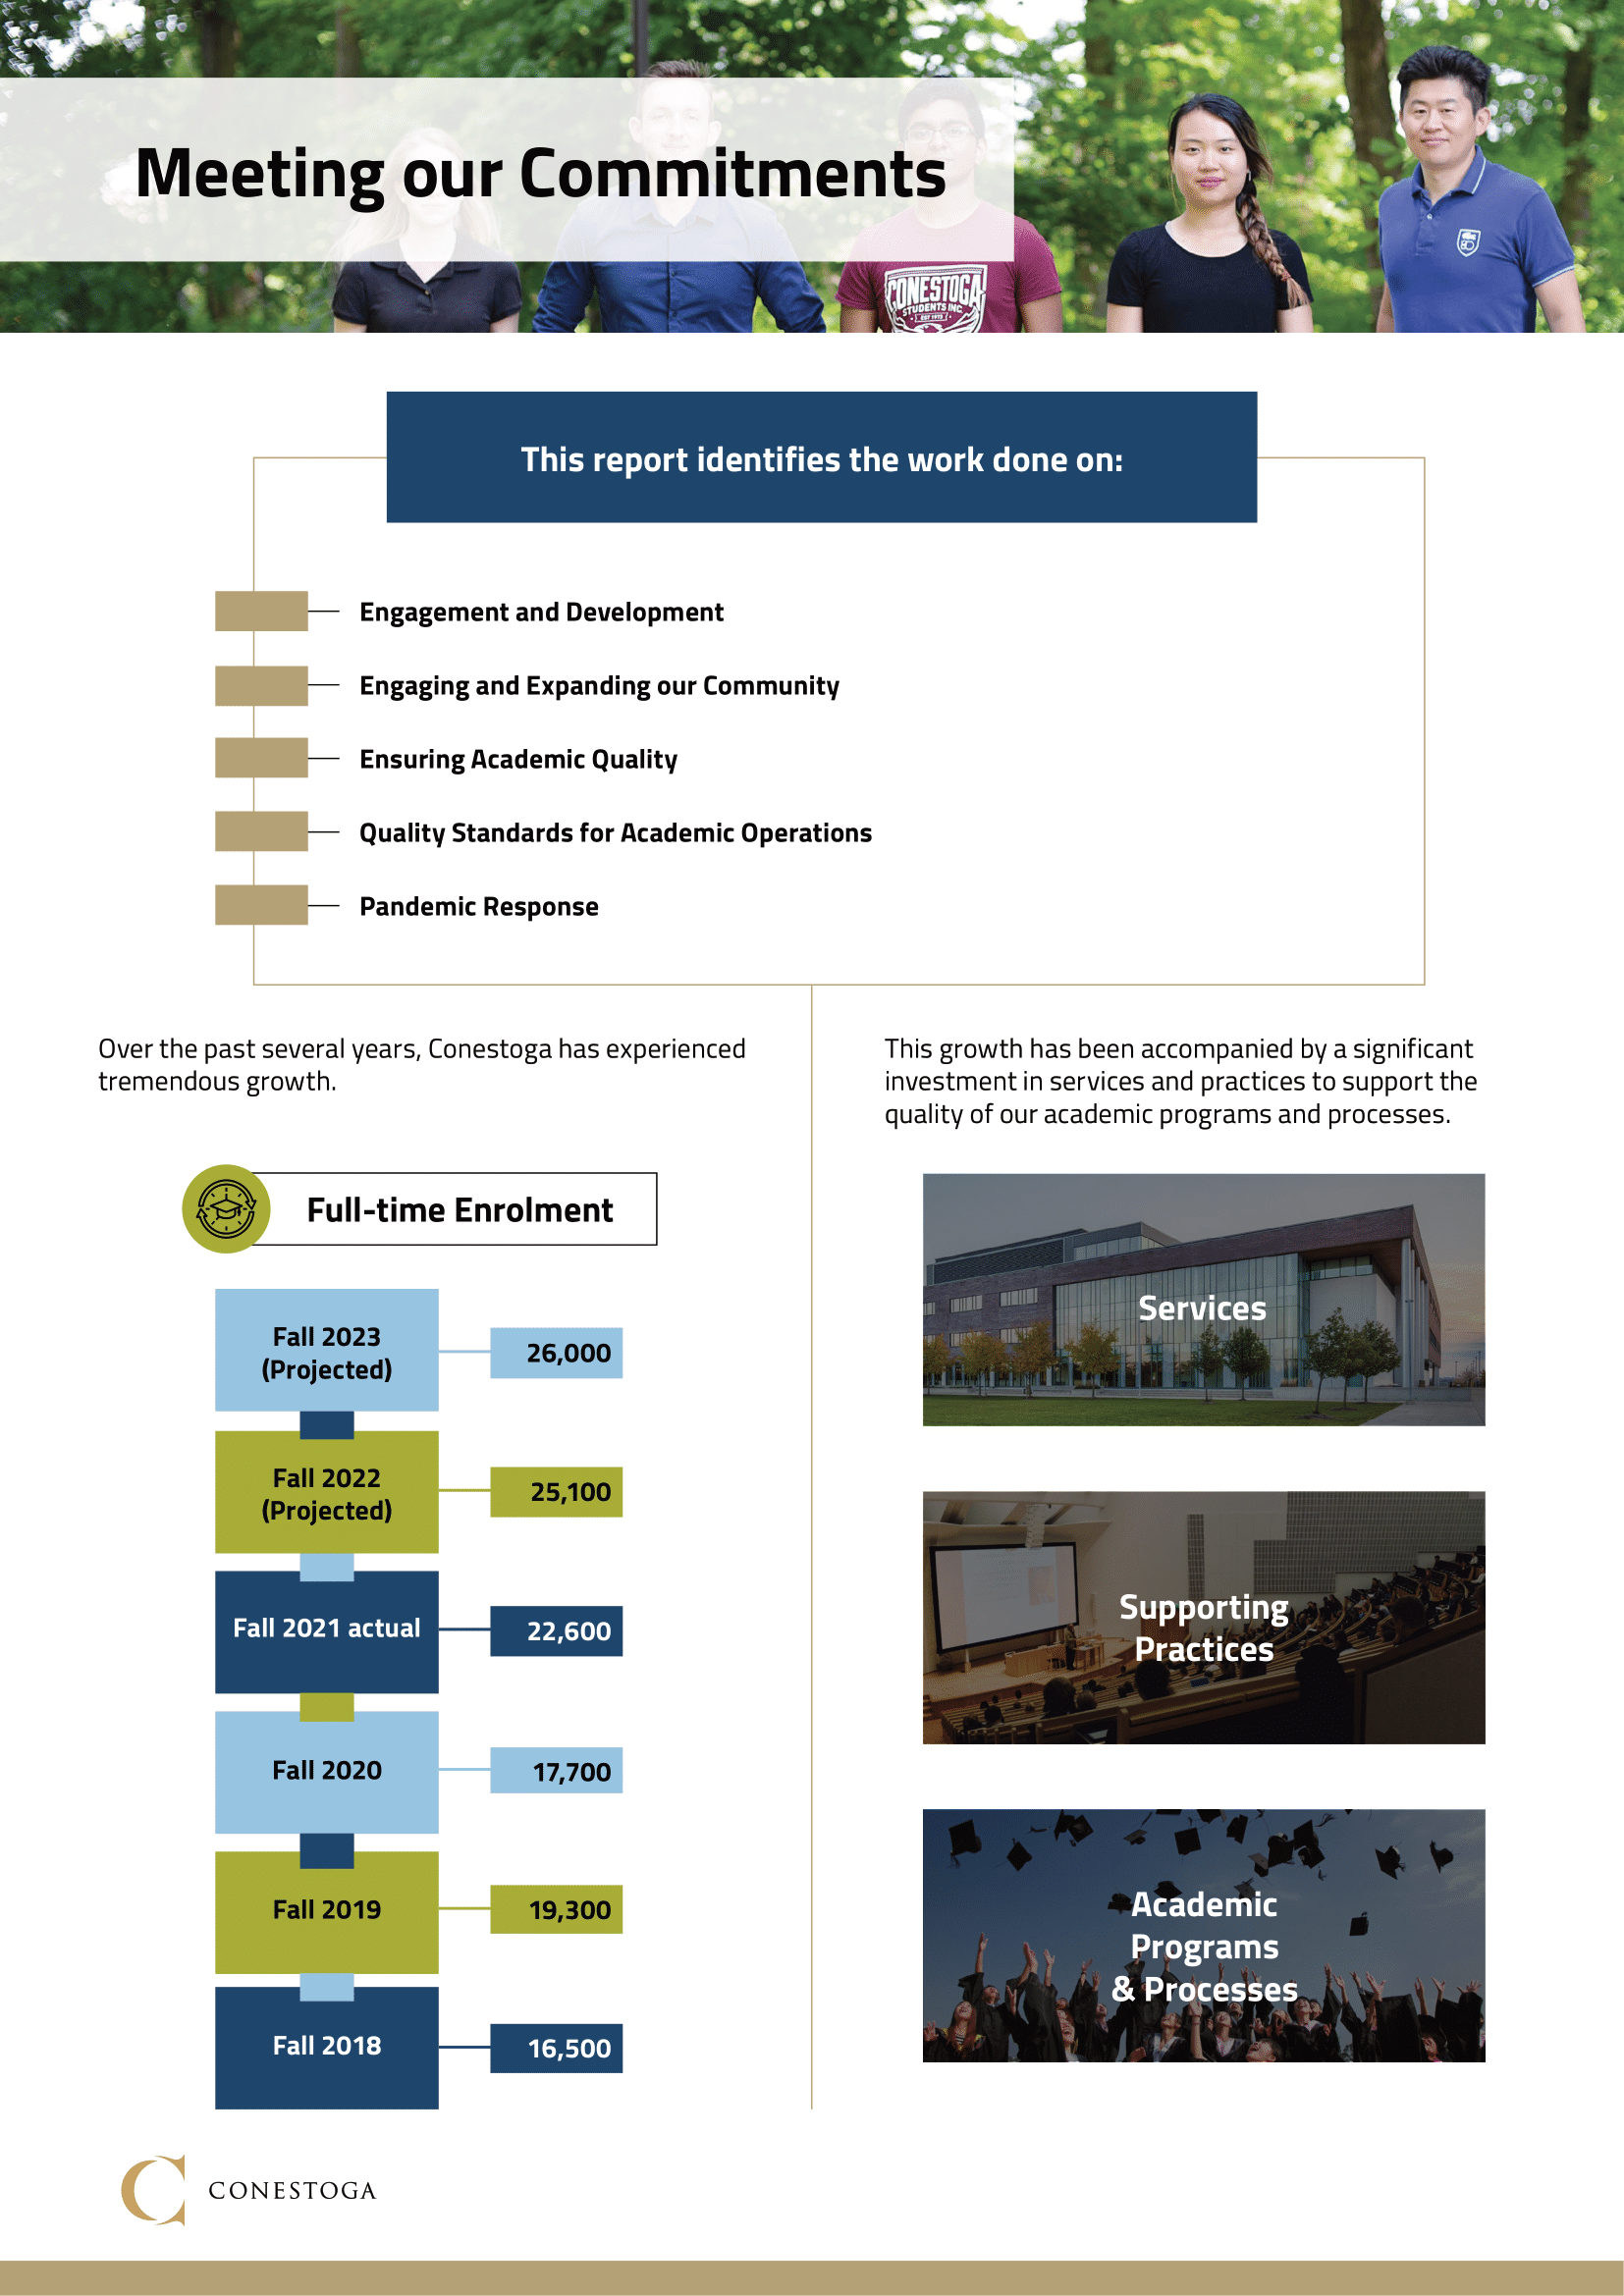
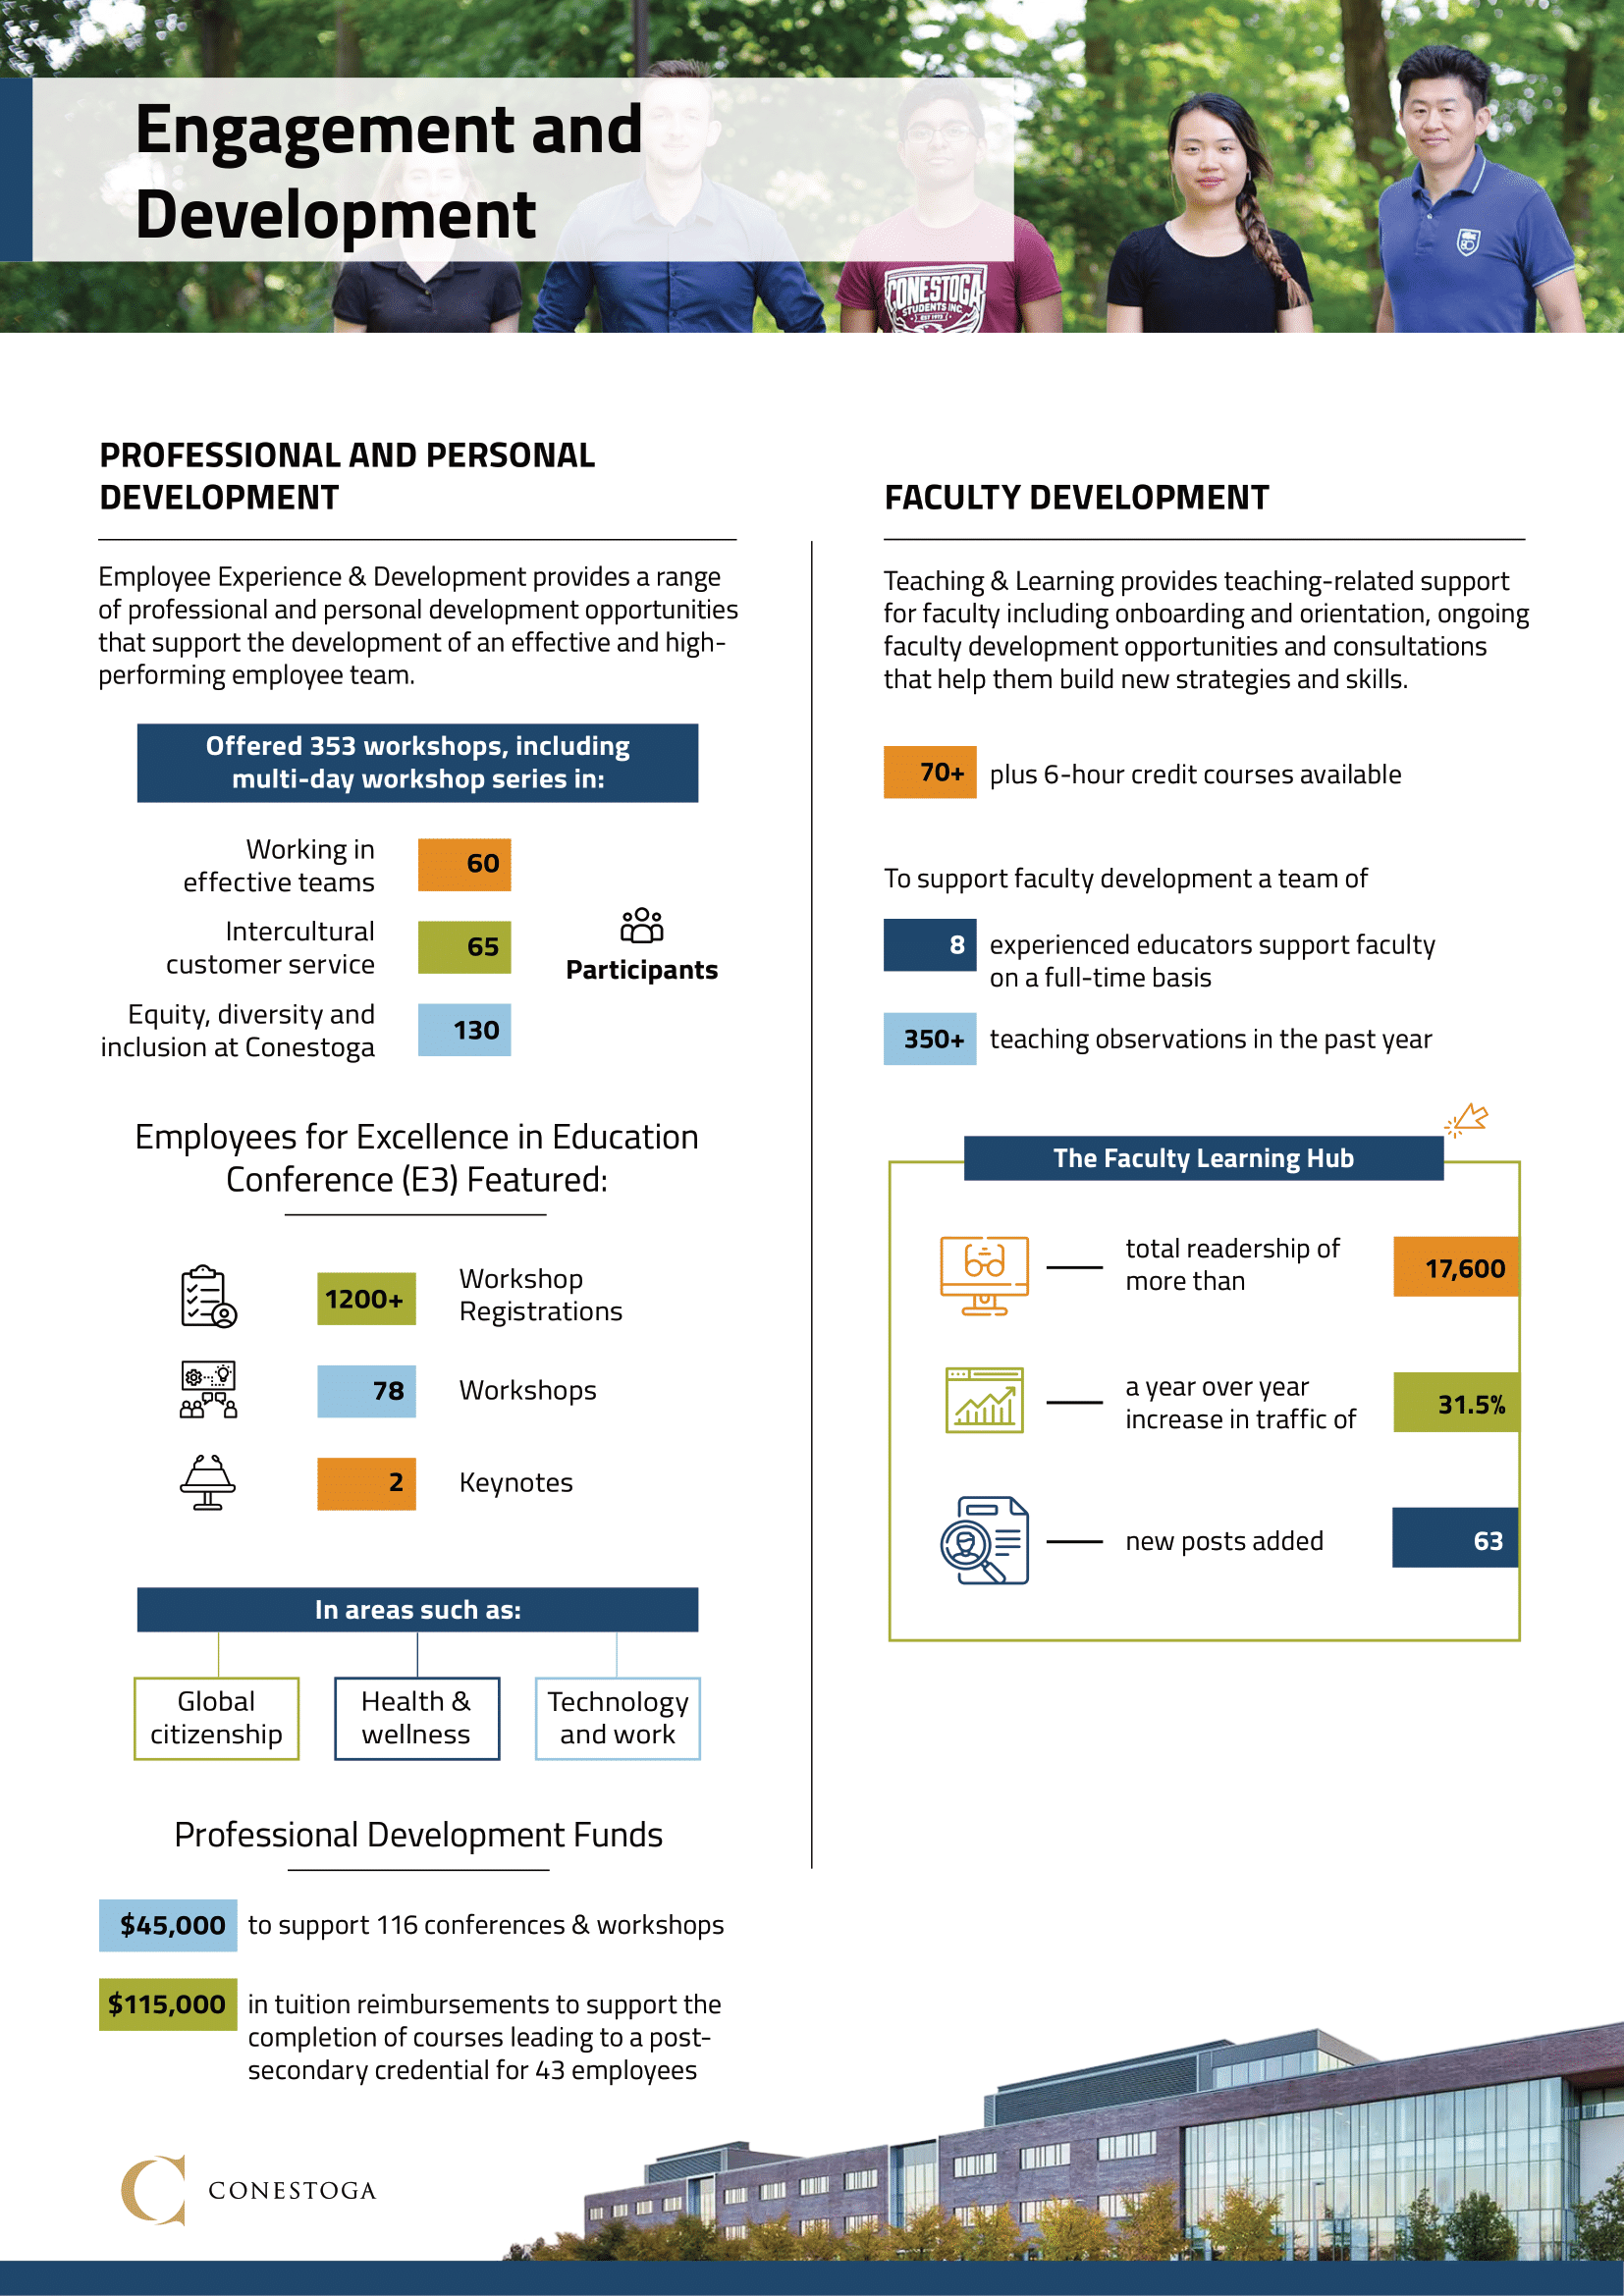
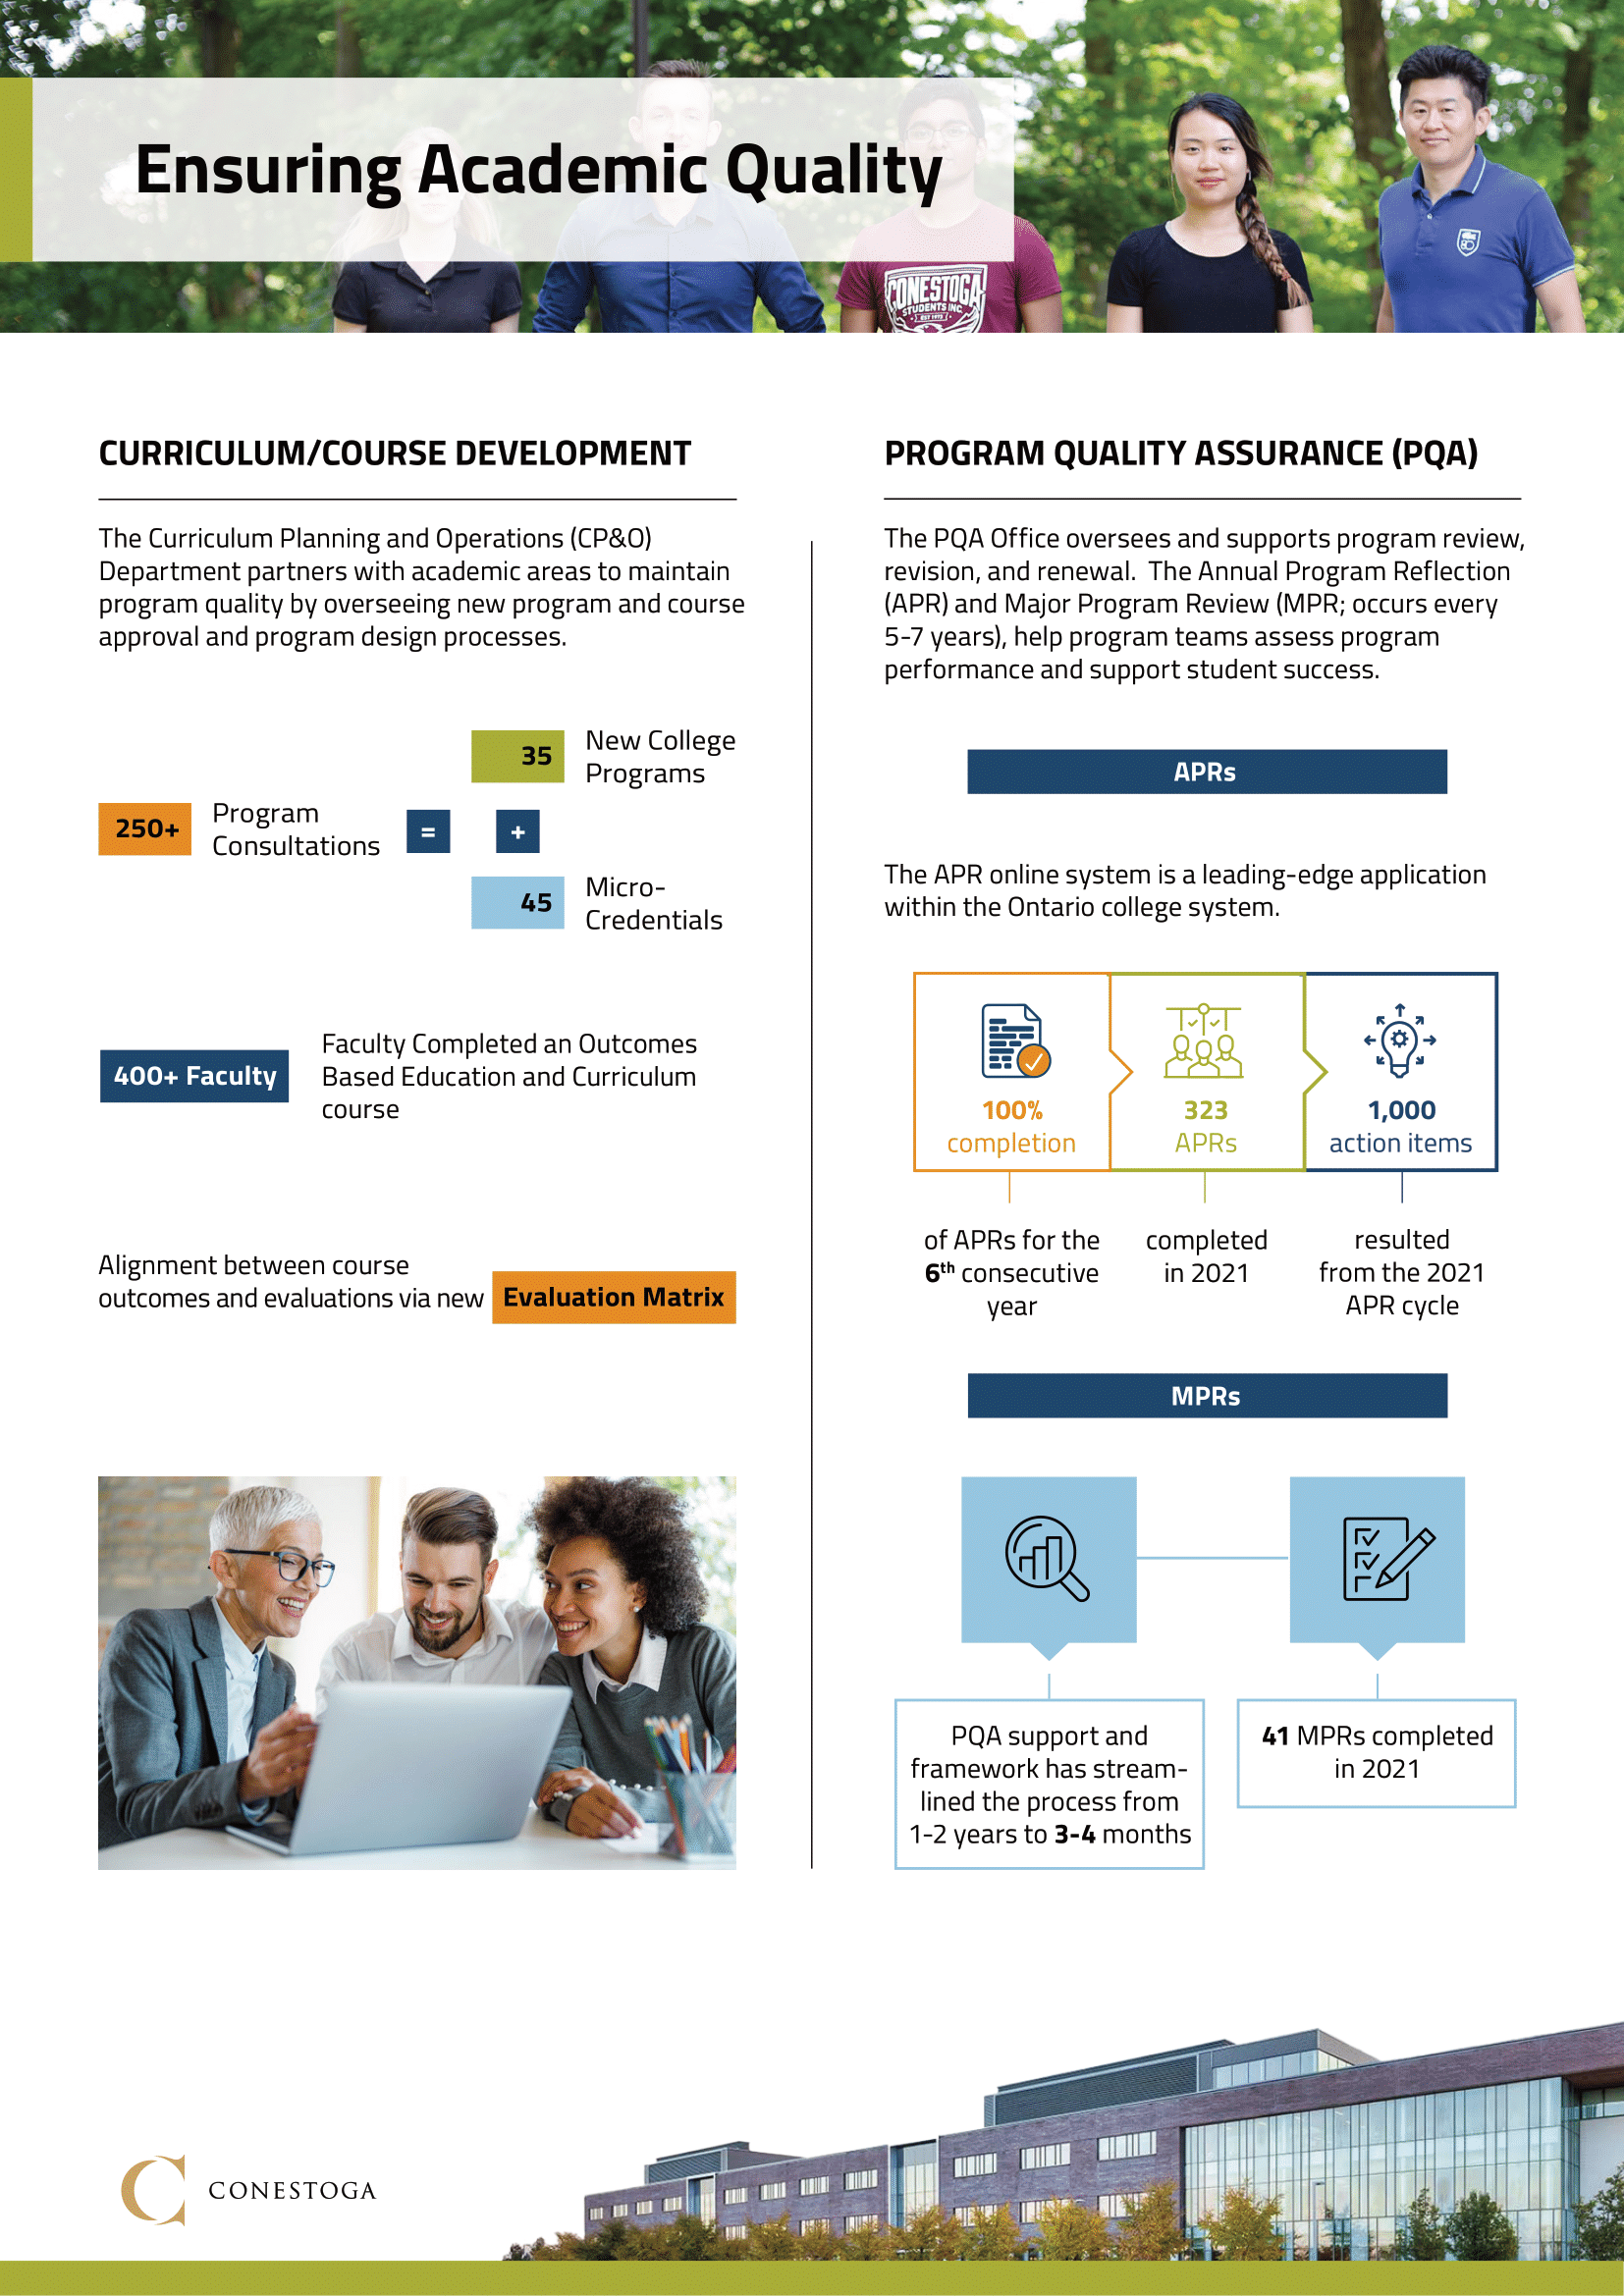
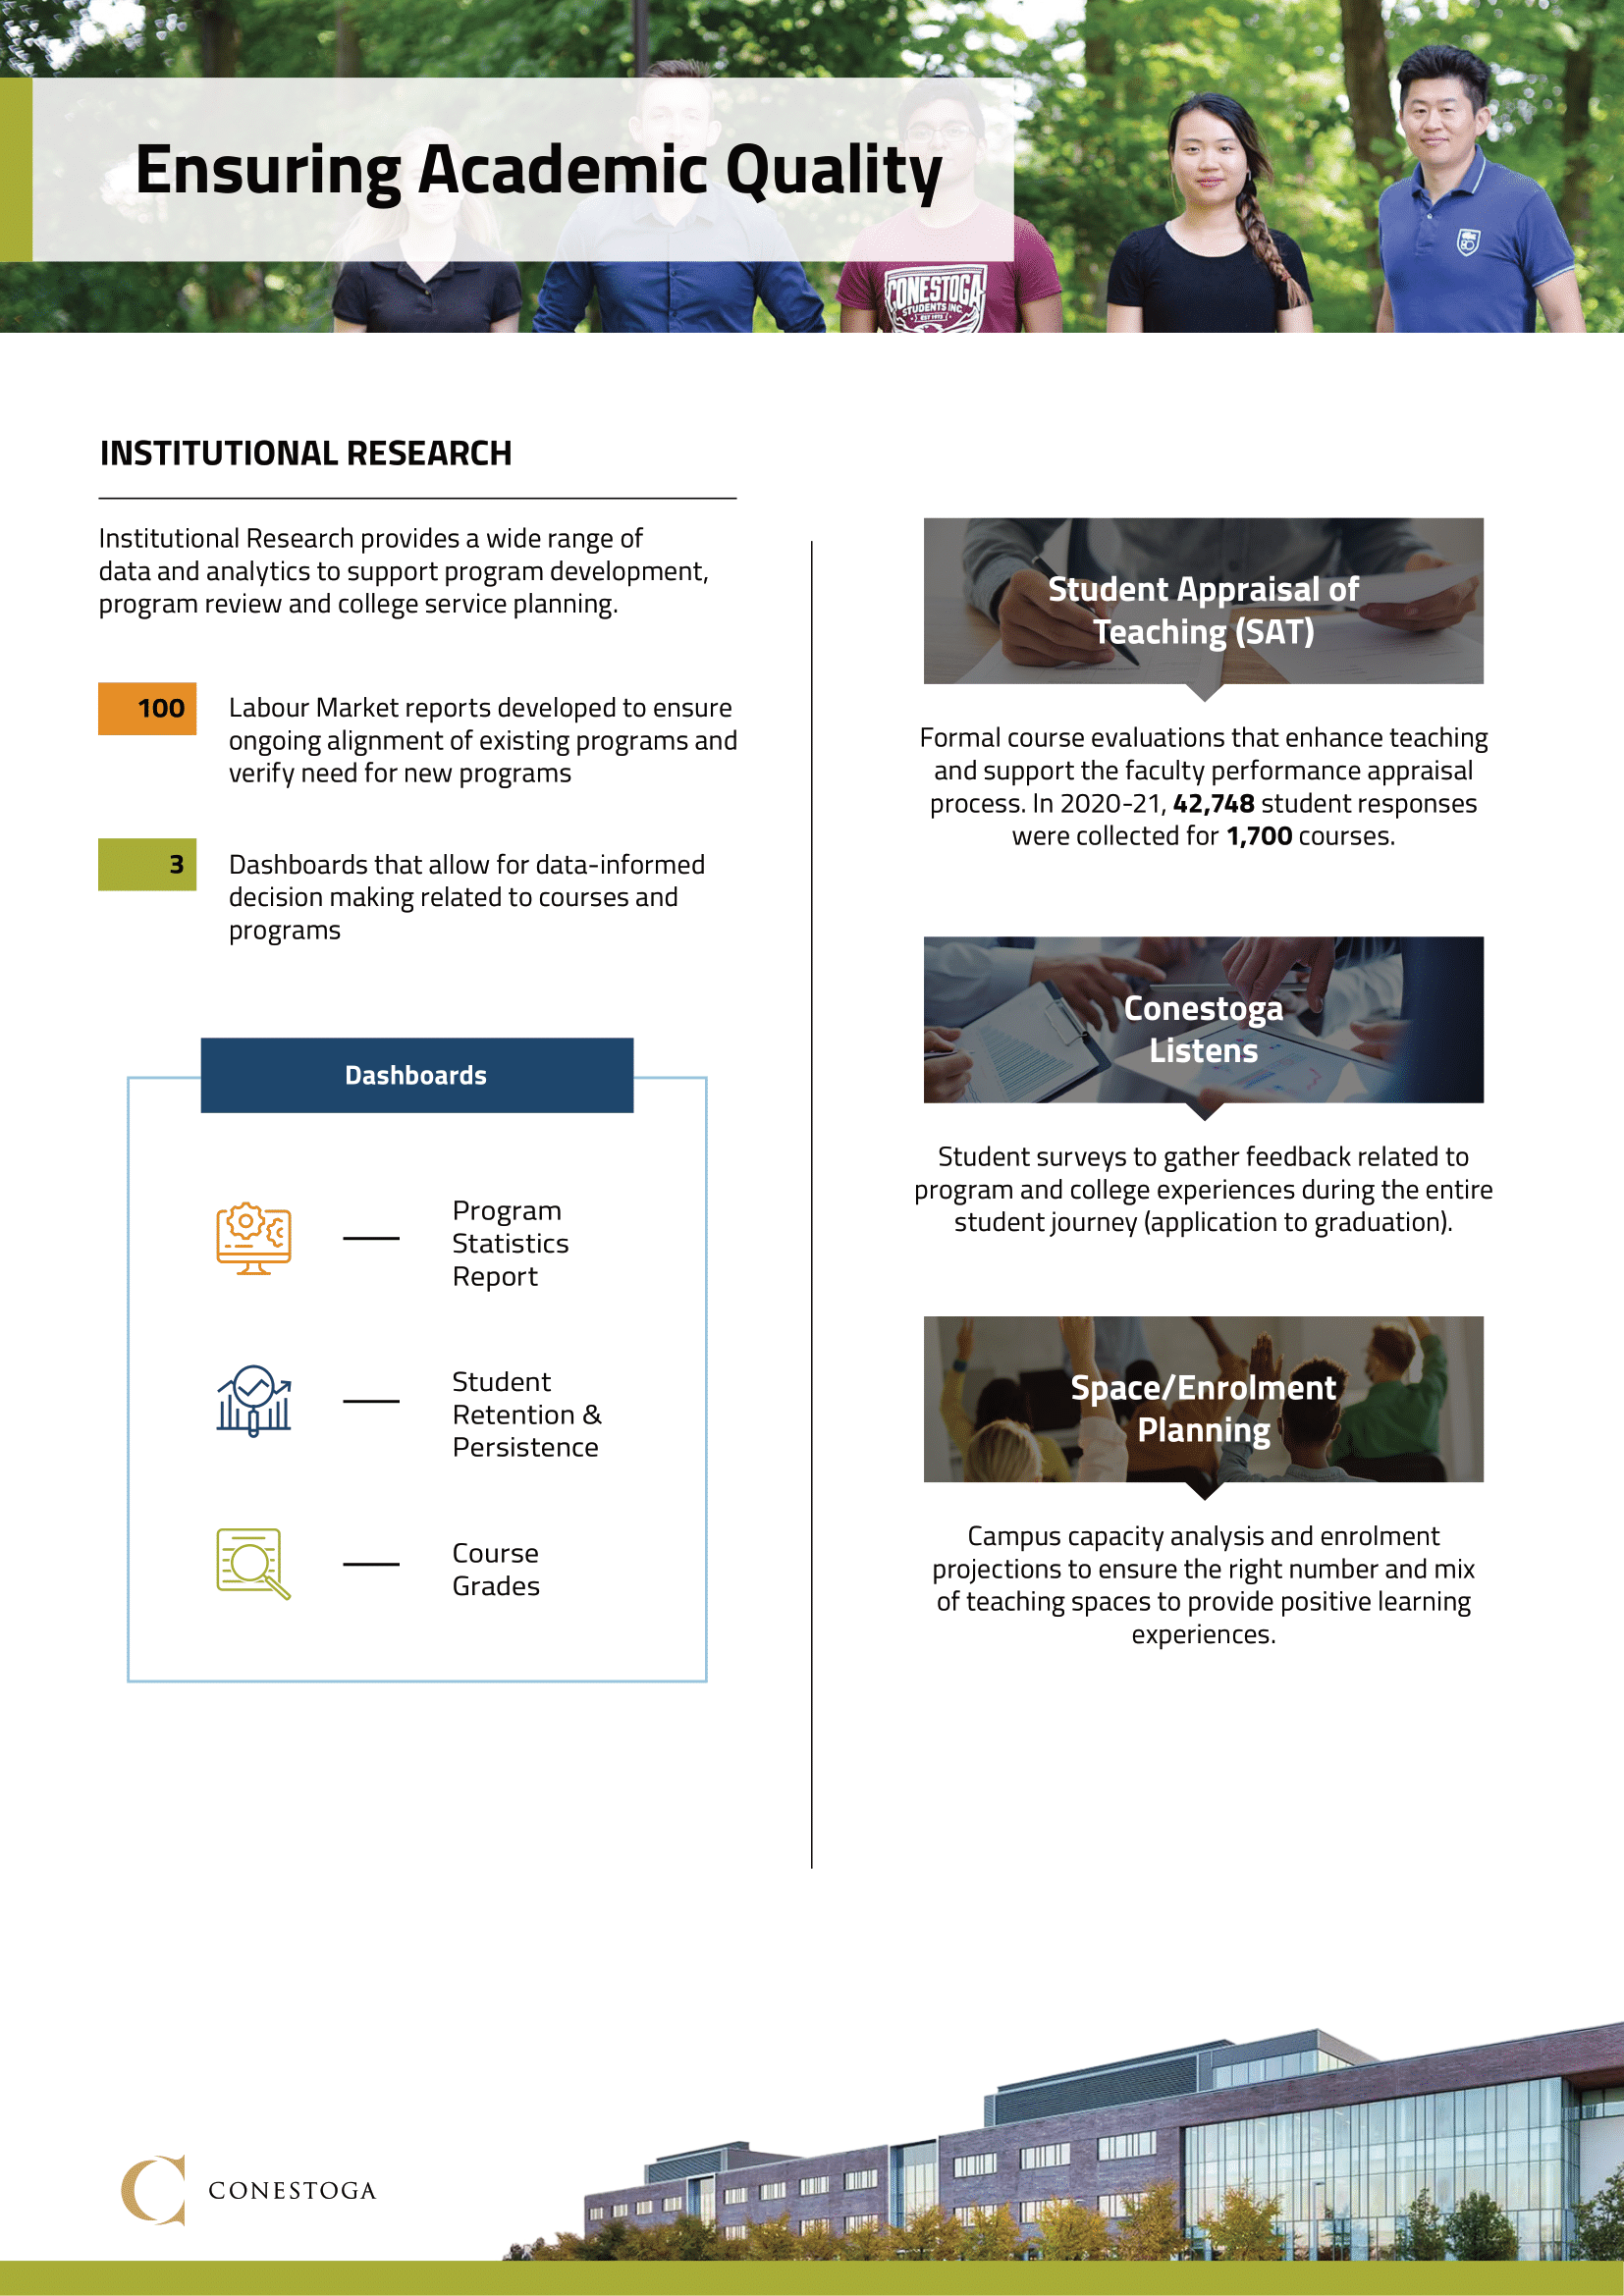
This infographic a visual representation of Conestoga College's 2021 Quality Report, created to make complex data easy to understand. With a modern design and color scheme aligned with the college's brand, this infographic is sure to grab attention. It uses a mix of charts, illustrations and icons to make the data more engaging, dynamic and visually appealing. The layout is easy to follow and it makes it simple for viewers to find the information they need quickly. This infographic is a valuable resource for stakeholders and decision-makers at the college. It's an effective way to communicate key findings and information from the report to a broad audience.

